What is data literacy?
Before diving into the world of Data Literacy, it is important to understand the two fundamental concepts which lay its foundation: data and literacy.
Definition of Data:
A sequence of one or more symbols given meaning by specific act(s) of interpretation. Data can be analysed or used in an effort to gain knowledge or make decisions. Digital data is represented using the binary number system of ones (1) and zeros (0) as opposed to its analogue representation. Data consists also in facts or information that can be used for reporting, calculations, planning, or analysis.
Definition of Literacy:
The ability to read and write; Knowledge of a particular subject, or a particular type of knowledge.
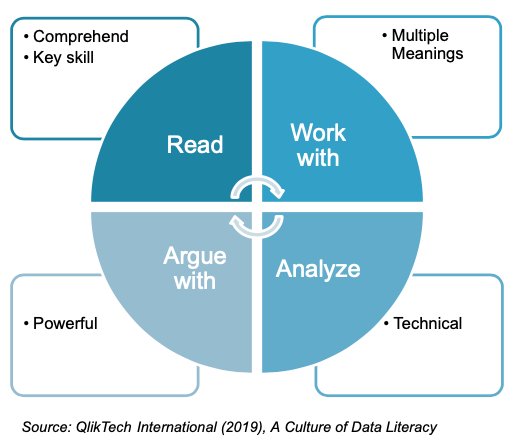
According to Raul Bhargava and Catherine D’ignazio from MIT and Emerson College, Data Literacy can be defined as the ability to read, work with, analyze, and argue with data. Although this definition showcases a relatively simple concept, it acquires raised complexity in todays’ increasingly digital and connected world, where information flows between all life valences and is widely accessible via Internet.
As such, Data Literacy acquires in itself a series of data related characteristics and sub competences areas that are many times pinpointed by different authors. This specificities are flexible, meaning that they can vary from model to model and within different contexts. Below, we present you at least 2 distinct Data Literacy Frameworks in which this flexibility is noticeable.
Watch this video before you continue: “What are Data and Data Literacy. Study Hall Data Literacy”
DigiComp 2.0
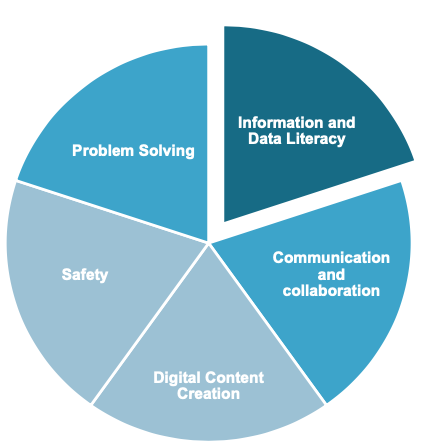
The European Commission’s DigiComp 2.0 (The Digital Competence Framework 2.0) identifies a set of key digital competences for European citizens. One of the 5 main areas included in the framework is Information and Data Literacy, defined as:
To articulate information needs, to locate and retrieve digital data, information and content. To judge the relevance of the source and its content. To store, manage, and organise digital data, information and content.
Download DigiComp 2.0 Framework for CItizens – Conceptual Reference Model here.Download DigiComp 2.0 Framework for CItizens – with examples here.
According to DigiComp 2.0, Data Literacy comprises three competences dimension: 1) Browsing, searching and filtering data, information and digital content; 2) Evaluating data, information and digital content; 3) Managing data, information and digital content. The three are described below.
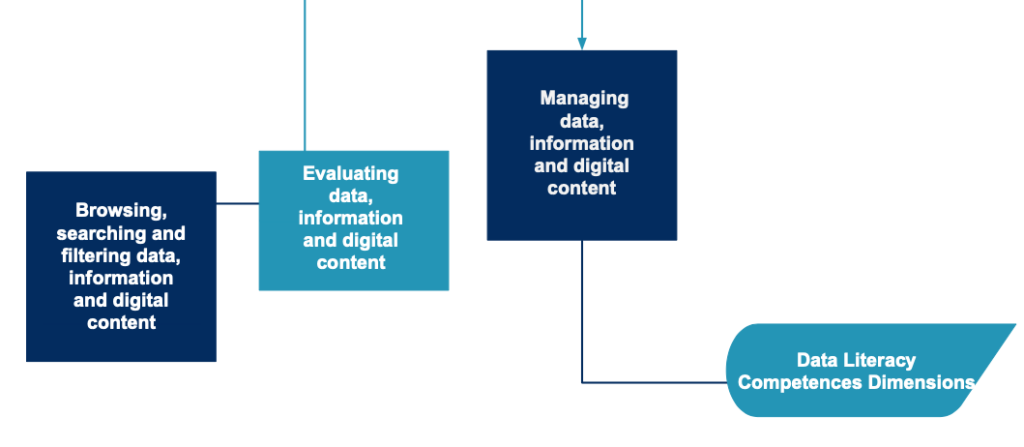
Browsing, searching and filtering data, information and digital content
- To articulate information needs, to search for data, information and content in digital environments, to access them and to navigate between them. To create and update personal search strategies.
Evaluating data, information and digital content
- To analyse, compare and critically evaluate the credibility and reliability of sources of data, information and digital content. To analyse, interpret and critically evaluate the data, information and digital content.
Managing data, information and digital content
- To organise, store and retrieve data, information and content in digital environments. To organise and process them in a structured environment.
Qlik Model
As explained, there are many different approaches to Data Literacy. Qlik presents a definition of Data Literacy which is based on the same common starting point: data literacy as the ability to read, work with, analyze, and argue with data. The concepts within the definition are those which are considered within its Data Literacy framework, as it can be seen in the picture.
Qlik model doesn’t just presente a definition framework for Data Literacy, but it also goes further and points out the following data literacy characteristics which are considered to be fundamental for a person or na organisation to consider itself Data Literate:
- Data Fluency: utilize the language, vocabulary, and conversational skills that go along with data literacy;
- Analytical Skills: utilize and develop analytical thinking skills, utilizing proper problem solving techniques;
- Statistical Methodologies: Data literacy culture utilizes and embraces statistics within the organization;
- Data Visualisations: help simplify data, enabling various skill-sets to absorb and utilize data.
Source: QlikTech International (2019), A Culture of Data Literacy
How to Become Data Literate?
Within any organization, being an university, a company or an association, it is important to ensure people are aware of data literacy. Many times, people need support in order either to gain or improve notions that help them go forward and become Data Literate. Regardless of one’s role (student, teacher, professional, manager, leader, director researcher…) it is key to consider the following:
- Understand the organization definition and view of data and data literacy;
- Don’t be reluctant on using more data on your daily tasks;
- Have a data culture mindset.
- Try to identify yourself with one of the four data personas:
- Data Scientist;
- Data Champion;
- Data Dreamer;
- Data Doubter.
- Top management level people at any organization should encourage the creation and implementation of the above elements.
DATA DOUBTER
• Need to maintain balance with the data doubter
• Help them see the “why” behind the data
• Can be a key to grow data literacy
• Help them progress within their skills
DATA DREAMER
• Beginners in the world of data
• Embody essence of data literacy
• Need to establish strong learning cadence
• Need to feed of their desires to learn
DATA CHAMPION
• Eager to learn
• Need to continue to grow data skills
• Grow use of data
• Ensure consistent learning
DATA SCIENTIST
• Crucial role
• Statistical skill-set
• Work well with data
• Mentors within organizations
Leaders Role
Leaders and top-level management with the power to influence institutions strategies have the ultimate responsibility to initiate and streamline Data Literacy among its employees, students, teachers, staff, etc..
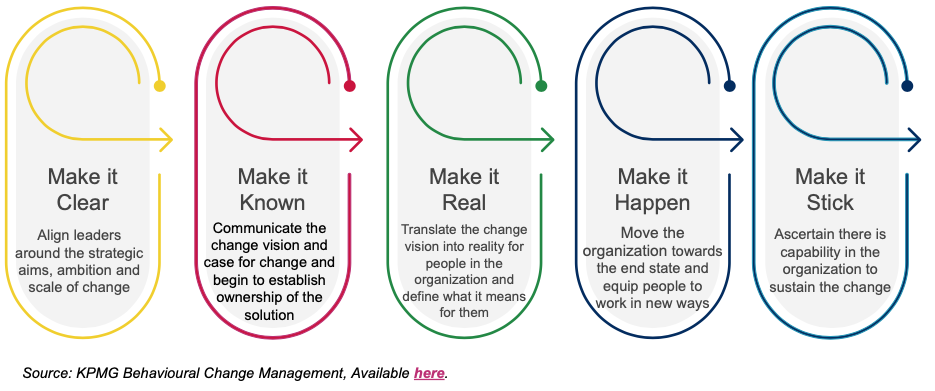
For such purpose, KPMG created a Behavioral Change Management Approach which can be used to guide and support the process of becoming Data Literate.
Data Key Concepts
In order for a person to become Data Literate, it is very important to understand some key basic notions related to data. The below concepts will help in navigating and better understanding data related subjects:
- Datum: each individual piece of information (like the temperature at exactly 4 pm yesterday) is a single data point, or datum.
- Data: All the information put together (like the full temperature range for yesterday) is data, or specific information one collects to make decisions.
- Data set: related collections of information.
- Data variables or types of data: particular types of information that we can use to split up a larger data set.
- Census: information from every member of a population
- Sample: a smaller sub-collection. It is a portion, part, or fraction of the whole group, and acts as a subset of the population
- Central Tendency: In statistics, a central tendency (or measure of central tendency) is a central or typical value for a probability distribution. It may also be called a center or location of the distribution. The three main measures of the central tendency are: mean; median; mode
Types of Data
Understanding the different types of data (in statistics, marketing research, or data science) allows you to pick the data type that most closely matches your needs and goals.
Whether you are a businessman, marketer, data scientist, student or another professional who works with some kinds of data, you should be familiar with the key list of data types.
Why? Because the various data classifications allow you to correctly use measurements and thus to correctly make decisions.

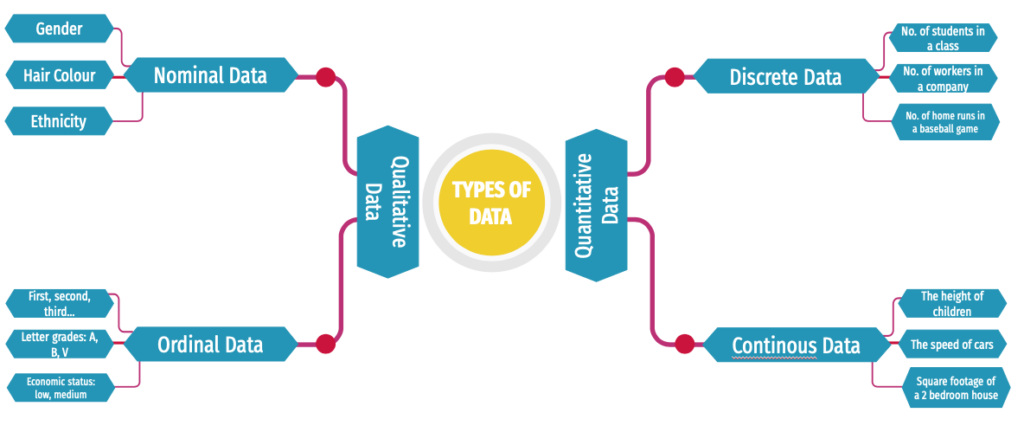
Quantitative vs Qualitative Data
| Quantitative data |
| Quantitative data seems to be the easiest to explain. It answers key questions such as “how many, “how much” and “how often”.Quantitative data can be expressed as a number or can be quantified. Simply put, it can be measured by numerical variables.Quantitative data are easily amenable to statistical manipulation and can be represented by a wide variety of statistical types of graphs and charts such as line, bar graph, scatter plot, and etc. Examples of quantitative data:Scores on tests and exams e.g. 85, 67, 90 and etc.The weight of a person or a subject.Your shoe size.The temperature in a room.There are 2 general types of quantitative data: discrete data and continuous data. |
| Qualitative data |
| Qualitative data can’t be expressed as a number and can’t be measured. Qualitative data consist of words, pictures, and symbols, not numbers.Qualitative data is also called categorical data because the information can be sorted by category, not by number.Qualitative data can answer questions such as “how this has happened” or and “why this has happened”. Examples of qualitative data:Colors e.g. the color of the seaYour favorite holiday destination such as Hawaii, New Zealand and etc.Names as John, Patricia,…..Ethnicity such as American Indian, Asian, etc.More you can see on our post qualitative vs quantitative data.There are 2 general types of qualitative data: nominal data and ordinal data. |
Nominal Vs Ordinal Data
| Nominal data |
| Nominal data is used just for labeling variables, without any type of quantitative value. The name ‘nominal’ comes from the Latin word “nomen” which means ‘name’.The nominal data just name a thing without applying it to order. Actually, the nominal data could just be called “labels.” Examples of Nominal Data:Gender (Women, Men)Hair color (Blonde, Brown, Brunette, Red, etc.)Marital status (Married, Single, Widowed)Ethnicity (Hispanic, Asian)As you see from the examples there is no intrinsic ordering to the variables.Eye color is a nominal variable having a few categories (Blue, Green, Brown) and there is no way to order these categories from highest to lowest. |
| Ordinal data |
| Ordinal data shows where a number is in order. This is the crucial difference from nominal types of data.Ordinal data is data which is placed into some kind of order by their position on a scale. Ordinal data may indicate superiority.However, you cannot do arithmetic with ordinal numbers because they only show sequence.Ordinal variables are considered as “in between” qualitative and quantitative variables.In other words, the ordinal data is qualitative data for which the values are ordered.In comparison with nominal data, the second one is qualitative data for which the values cannot be placed in an ordered.We can also assign numbers to ordinal data to show their relative position. But we cannot do math with those numbers. For example: “first, second, third…etc.” Examples of Ordinal Data:The first, second and third person in a competition.Letter grades: A, B, C, and etc.When a company asks a customer to rate the sales experience on a scale of 1-10.Economic status: low, medium and high. |
Discrete vs Continuous Data
| Discrete data |
| As we mentioned above discrete and continuous data are the two key types of quantitative data. In statistics, marketing research, and data science, many decisions depend on whether the basic data is discrete or continuous.Discrete data is a count that involves only integers. The discrete values cannot be subdivided into parts.For example, the number of children in a class is discrete data. You can count whole individuals. You can’t count 1.5 kids.To put in other words, discrete data can take only certain values. The data variables cannot be divided into smaller parts.It has a limited number of possible values e.g. days of the month. Examples of discrete data:The number of students in a class.The number of workers in a company.The number of home runs in a baseball game.The number of test questions you answered correctly |
| Continuous data |
| Continuous data is information that could be meaningfully divided into finer levels. It can be measured on a scale or continuum and can have almost any numeric value.For example, you can measure your height at very precise scales — meters, centimeters, millimeters and etc.You can record continuous data at so many different measurements – width, temperature, time, and etc. This is where the key difference from discrete types of data lies.The continuous variables can take any value between two numbers. For example, between 50 and 72 inches, there are literally millions of possible heights: 52.04762 inches, 69.948376 inches and etc.A good great rule for defining if a data is continuous or discrete is that if the point of measurement can be reduced in half and still make sense, the data is continuous. Examples of continuous data:The amount of time required to complete a project.The height of children.The square footage of a two-bedroom house.The speed of cars. |